Dashboard
LocalEmu includes a built-in web console for monitoring and exploring your local AWS
environment in real time. It starts automatically with LocalEmu, no configuration needed, at
http://localhost:4566/_localemu/dashboard.
Every screenshot on this page is a real console session: a live LocalEmu instance with over
120 services actually provisioned, screenshotted as-is.
Everything, live
A requests-per-second chart, a grid of every registered service, and resource counts that update from the real event stream, not a poll-and-hope refresh.
Drill into anything
Click any service to see its real resources: instances, tables, buckets, functions. Click into S3 or DynamoDB to browse objects and items directly.
Cmd+K for everything
A command palette jumps to any service, resource, or write action by name. No menu-hunting.
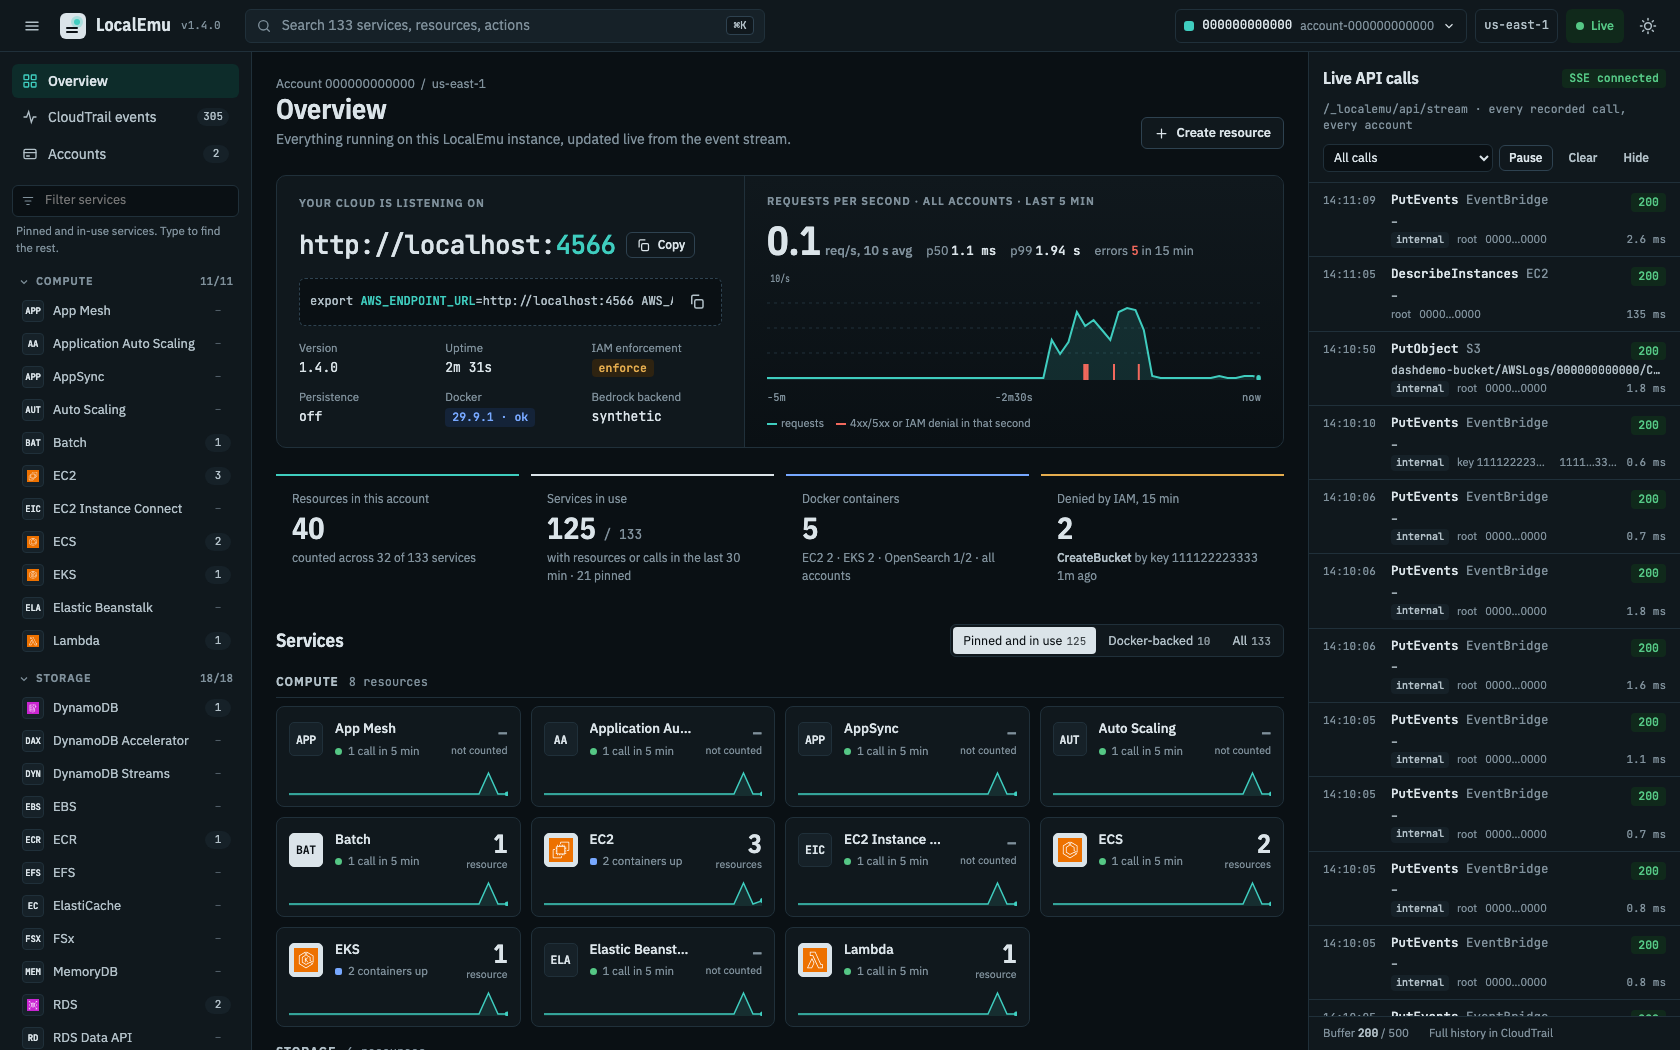
Overview
The landing page: endpoint and a copyable AWS_ENDPOINT_URL
export, version, uptime, IAM enforcement mode, Docker backend status, a requests-per-second chart
with IAM-denial markers, and a grid of every service in use. The instance below has 125 of 133
registered services in use, 40 counted resources, and 5 Docker containers backing real EC2/EKS workloads.
Resource drill-down
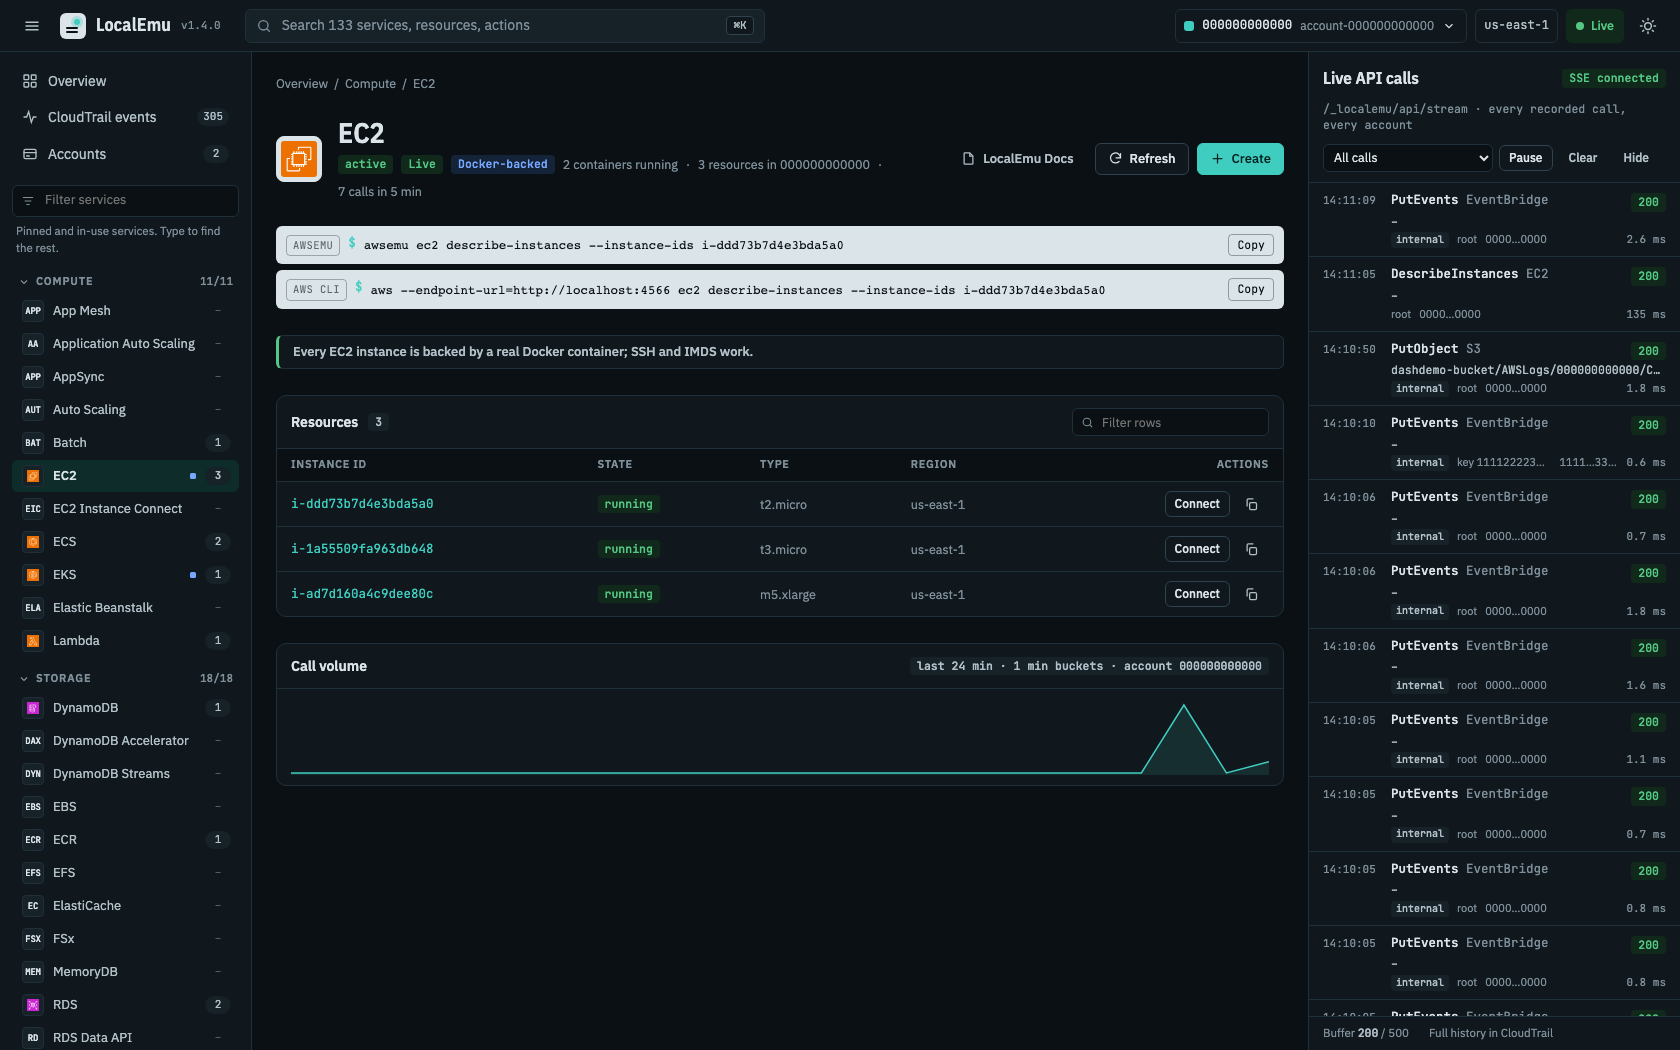
Click any service to see its real resources — here, three EC2 instances, each backed by a real
Docker container, with the exact awsemu and
aws CLI commands to reproduce the view, and a
per-service call-volume chart.
S3 object browser and DynamoDB item viewer
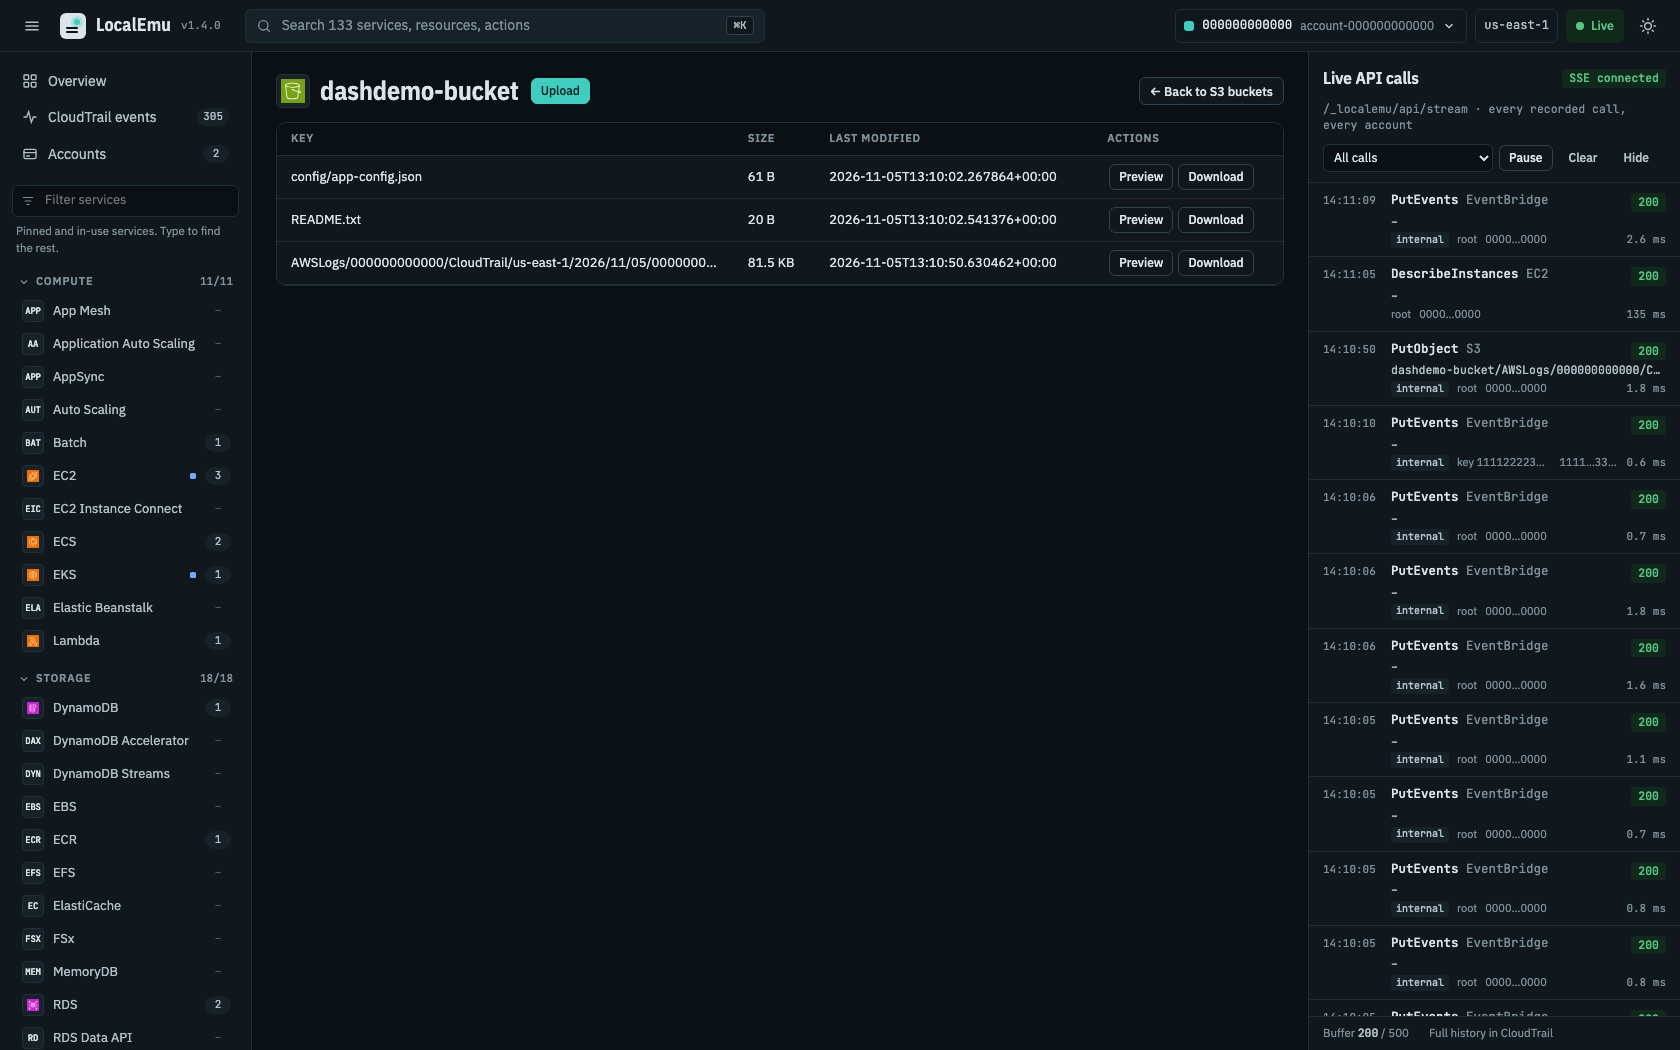
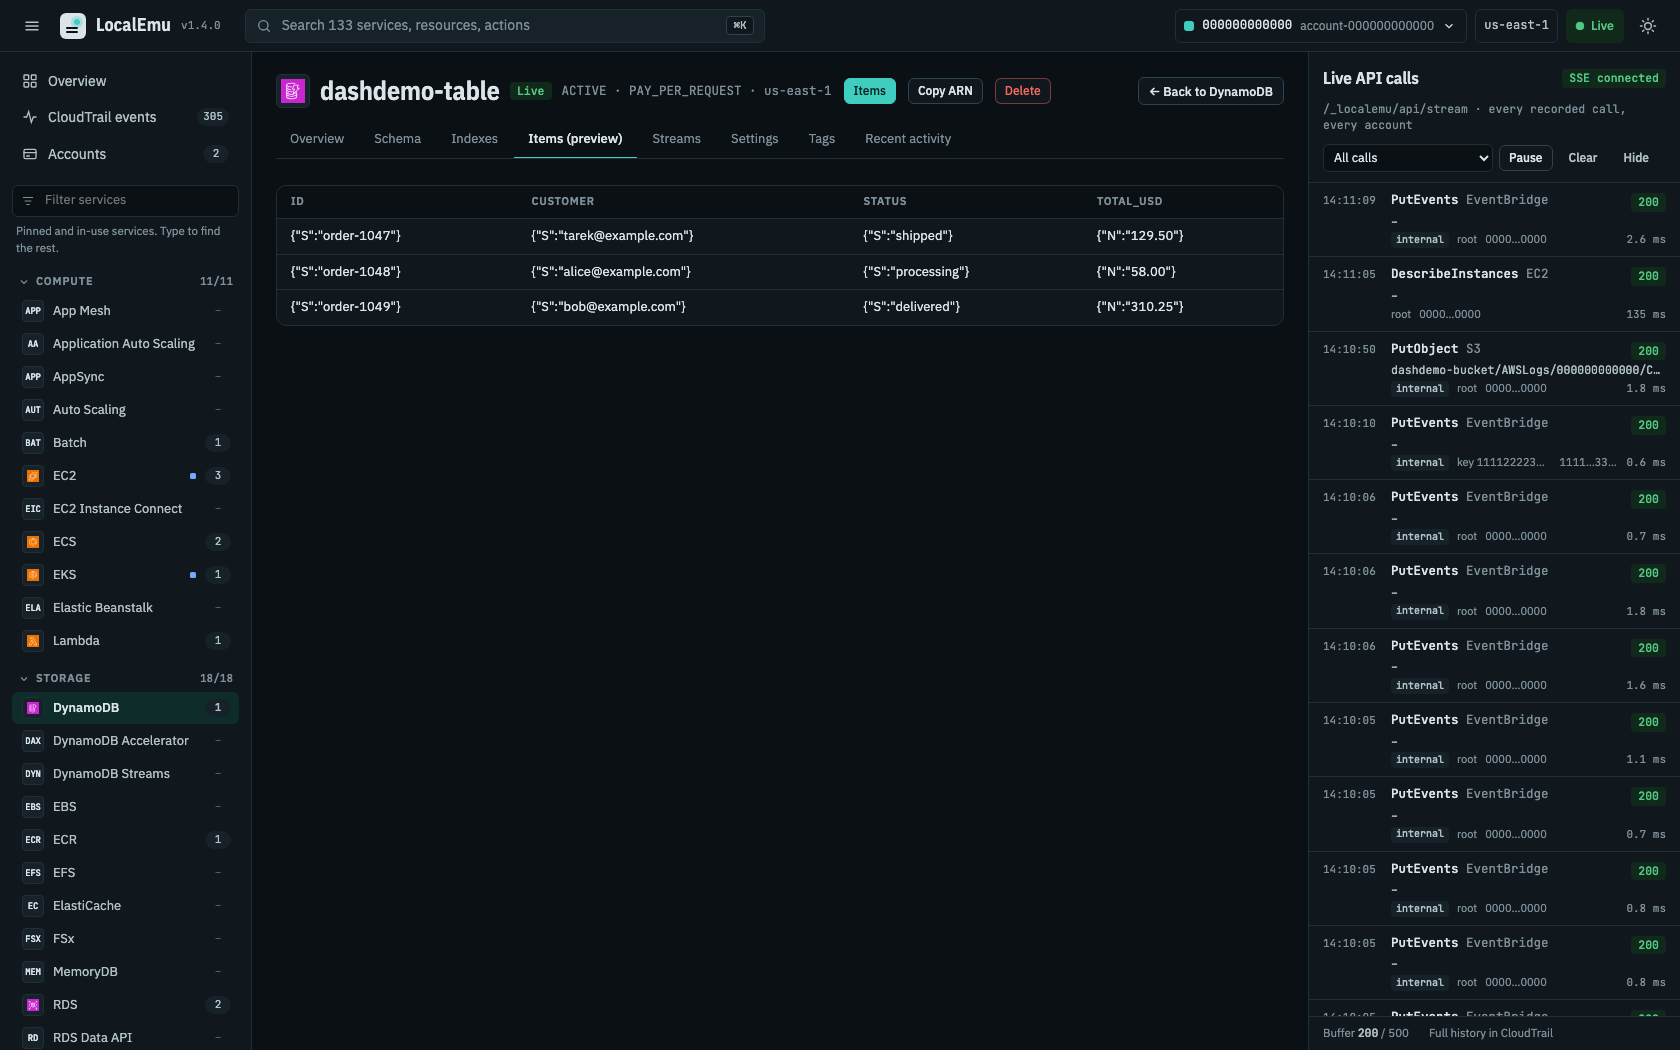
Browse into a bucket or table without leaving the console. Below: a real bucket holding CloudTrail
logs plus two uploaded files, and a real table holding three order items — all click-through, with
the live call stream on the right showing the exact PutObject
and PutItem calls that created them.
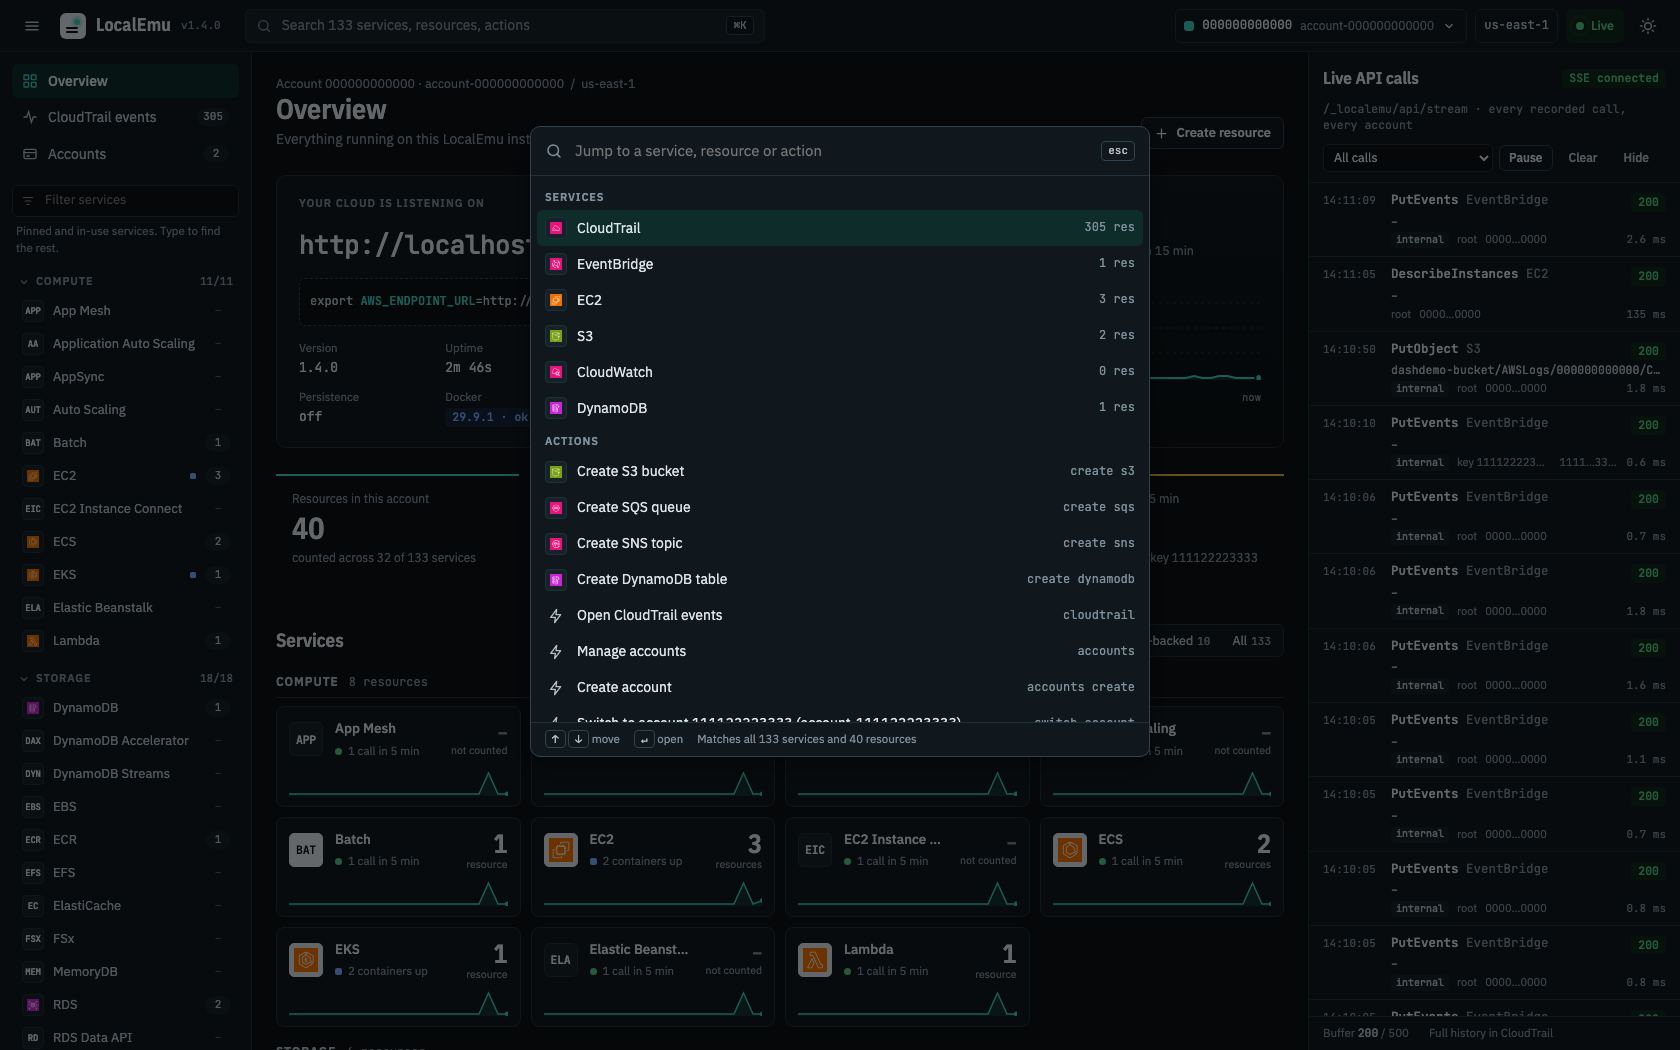
Command palette
Cmd+K, Ctrl+K,
or / opens a fuzzy jump-to for every service,
resource, and write action — "matches all 133 services and 40 resources" live, as typed.
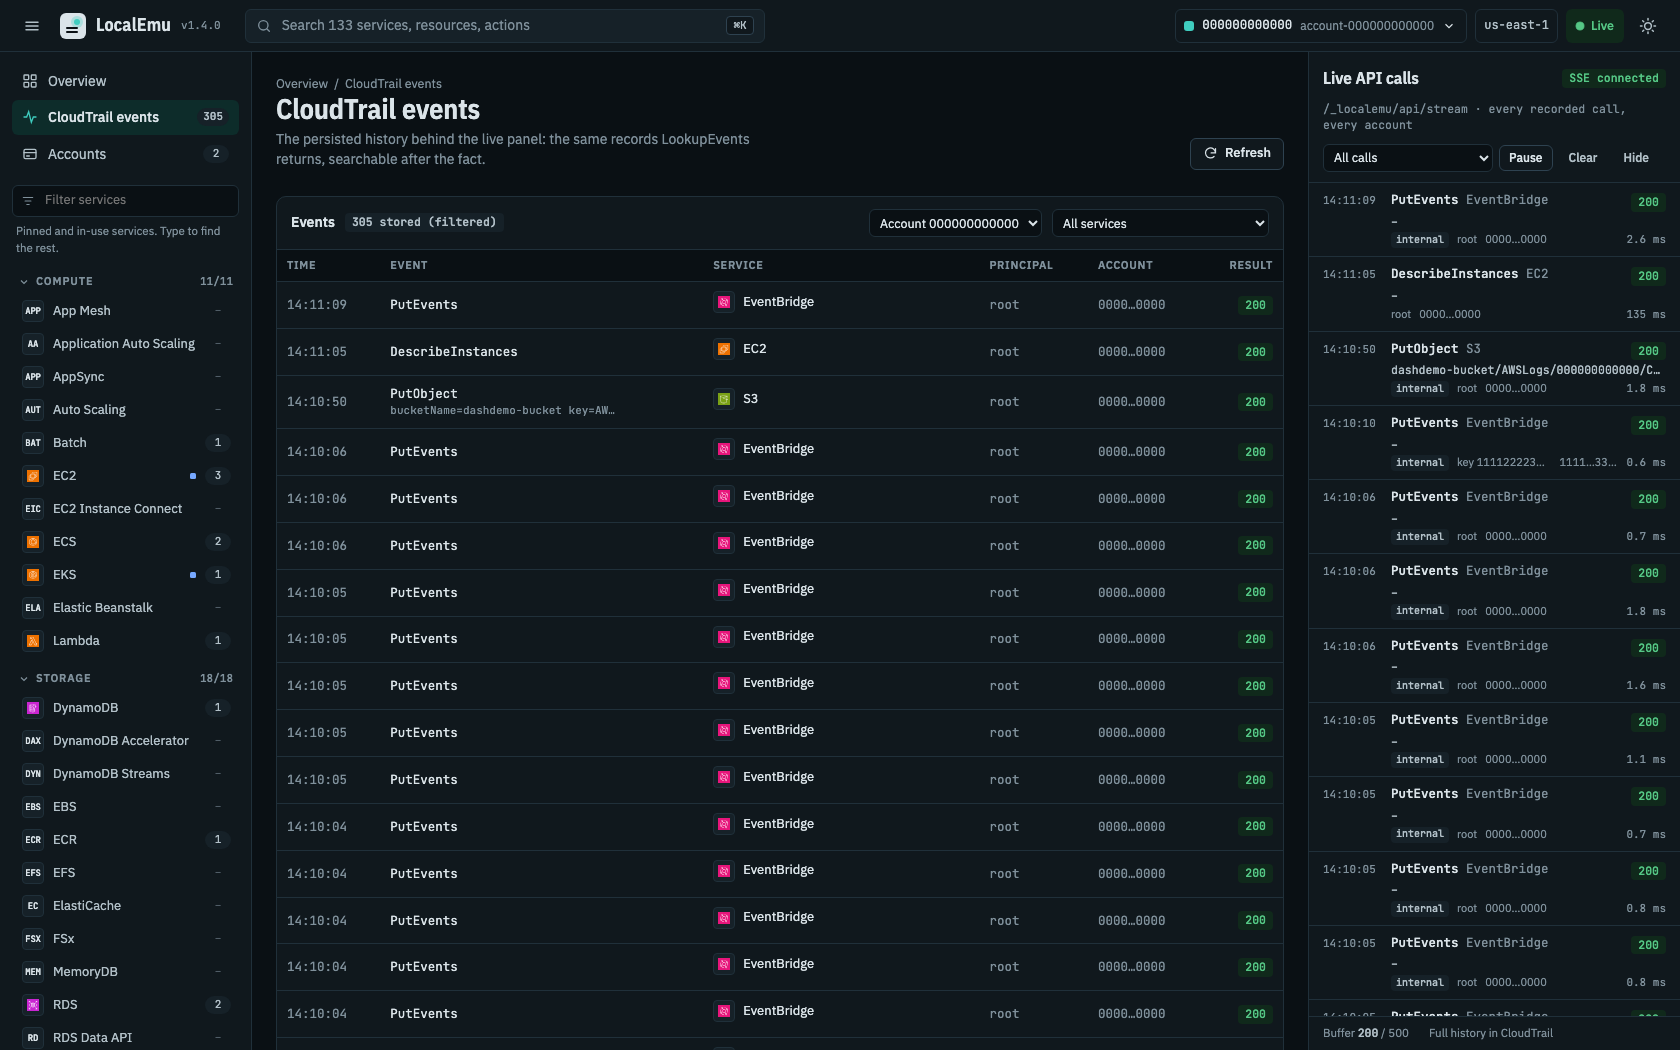
CloudTrail event history
The persisted history behind the live call panel: the same records LookupEvents
returns, searchable after the fact and filterable by account or service.
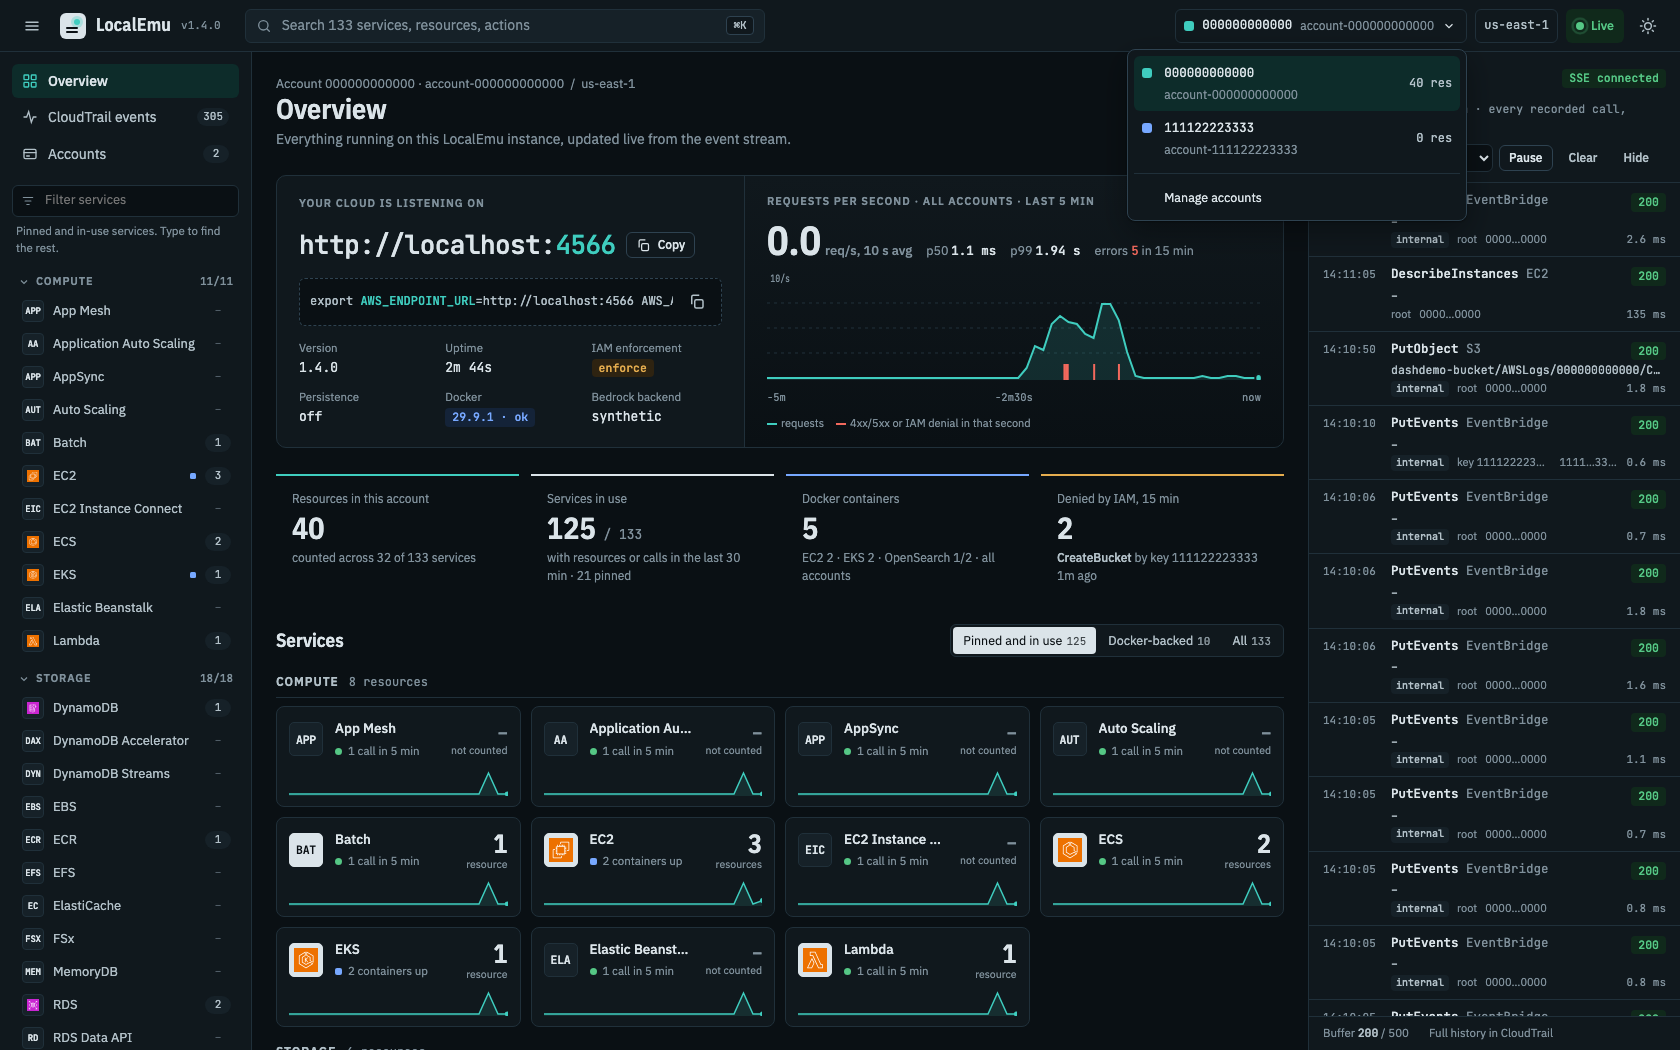
Account switcher
LocalEmu derives the AWS account from the access key on every call, so a second account is just a
different AWS_ACCESS_KEY_ID away — no setup
step. Below, a second account (111122223333) was
created by its first call and switched to from the top bar; its attempts to create resources
without any IAM grant are correctly denied with 403,
visible live in the call panel, under IAM_ENFORCEMENT=1.
Try it yourself: start LocalEmu
(localemu start) and open
http://localhost:4566/_localemu/dashboard — no
flags, no setup. See the Installation
page to get started.